
golang的pprof基本使用
什么是pprof
pprof 是用于可视化和分析性能分析的工具
开启pprof
1 | package main |
使用浏览器访问:
http://127.0.0.1:8080/debug/pprof/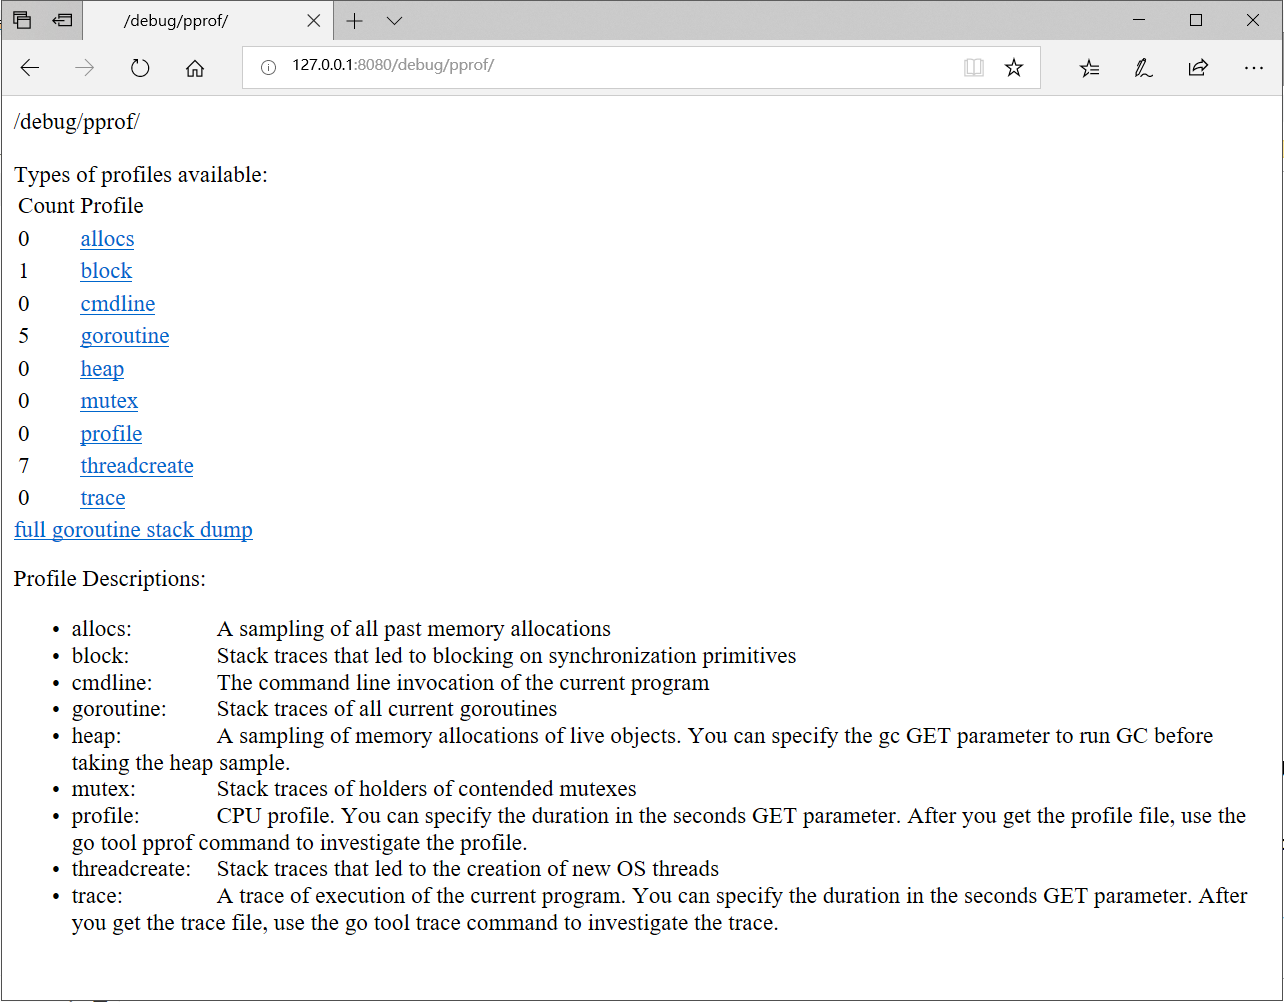
程序采样的数据分别:
类型 描述 allocs 内存分配情况的采样信息 block 阻塞操作情况的采样信息 cmdline 显示程序启动命令及参数 goroutine 当前所有协程的堆栈信息 heap 堆上内存使用情况的采样信息 mutex 锁争用情况的采样信息 profile CPU 占用情况的采样信息 threadcreate 系统线程创建情况的采样信息 trace 程序运行跟踪信息 由于直接阅读采样信息缺乏直观性,我们需要借助
go tool pprof命令来排查问题,这个命令是 go 原生自带的,所以不用额外安装
安装图形化工具graphviz
1 | brew install graphviz # for macos |
CPU占用过高
程序案例代码
1 | package main |
执行采集cpu命令:
go tool pprof -cum http://127.0.0.1:8080/debug/pprof/profile,默认采集30秒的运行信息
可以通过go tool pprof -cum http://127.0.0.1:8080/debug/pprof/profile?seconds=60来更改采集的时间
进入交互终端
1 | E:\go_project\go-pprof>go tool pprof -cum http://127.0.0.1:8080/debug/pprof/profile |
top命令,查看CPU占用高的调用1
2
3
4
5
6
7
8
9
10
11
12
13
14
15
16
17(pprof) top
Showing nodes accounting for 0.25s, 0.83% of 29.99s total
Dropped 96 nodes (cum <= 0.15s)
Showing top 10 nodes out of 17
flat flat% sum% cum cum%
0.02s 0.067% 0.067% 29.90s 99.70% main.Egt
0 0% 0.067% 29.90s 99.70% main.main
0 0% 0.067% 29.90s 99.70% runtime.main
0.01s 0.033% 0.1% 29.10s 97.03% fmt.Println
0.02s 0.067% 0.17% 29.09s 97.00% fmt.Fprintln
0.04s 0.13% 0.3% 28.89s 96.33% os.(*File).Write
0.02s 0.067% 0.37% 28.85s 96.20% os.(*File).write
0.04s 0.13% 0.5% 28.83s 96.13% internal/poll.(*FD).Write
0.10s 0.33% 0.83% 28.59s 95.33% internal/poll.(*FD).writeConsole
0 0% 0.83% 28.31s 94.40% syscall.WriteConsole
(pprof)类型 说明 flat 运行耗时间 flat% CPU 运行耗时总比例 sum% 累计使用 CPU 总比例 cum 当前函数加上它之上的调用运行总耗时 cum% CPU 运行耗时总比例 可以看出 main.Egt方法的cpu占用最高
list Egt命令查询问题在代码的哪个位置1
2
3
4
5
6
7
8
9
10
11
12
13
14
15
16(pprof) list Egt
Total: 30.01s
ROUTINE ======================== main.Egt in E:\go_project\go-pprof\main.go
70ms 28.51s (flat, cum) 95.00% of Total
. . 32: }
. . 33:}
. . 34:
. . 35:func Egt() {
. . 36: for{
50ms 50ms 37: var folst = 86465.1213213
10ms 3.66s 38: float := strconv.FormatFloat(folst, 'f', -1, 64)
10ms 24.80s 39: fmt.Println(float)
. . 40: }
. . 41:}
(pprof)可以看到是39行高频的打印输出占用了大量 CPU 时间,至此,问题定位成功!
web命令,或者使用go tool pprof -inuse_space -cum -svg http://127.0.0.1:8080/api-box/debug/pprof/heap > heap_inuse.svg下载svg文件在用浏览器打开,图形化工具自动加载1
2
3(pprof) web
(pprof)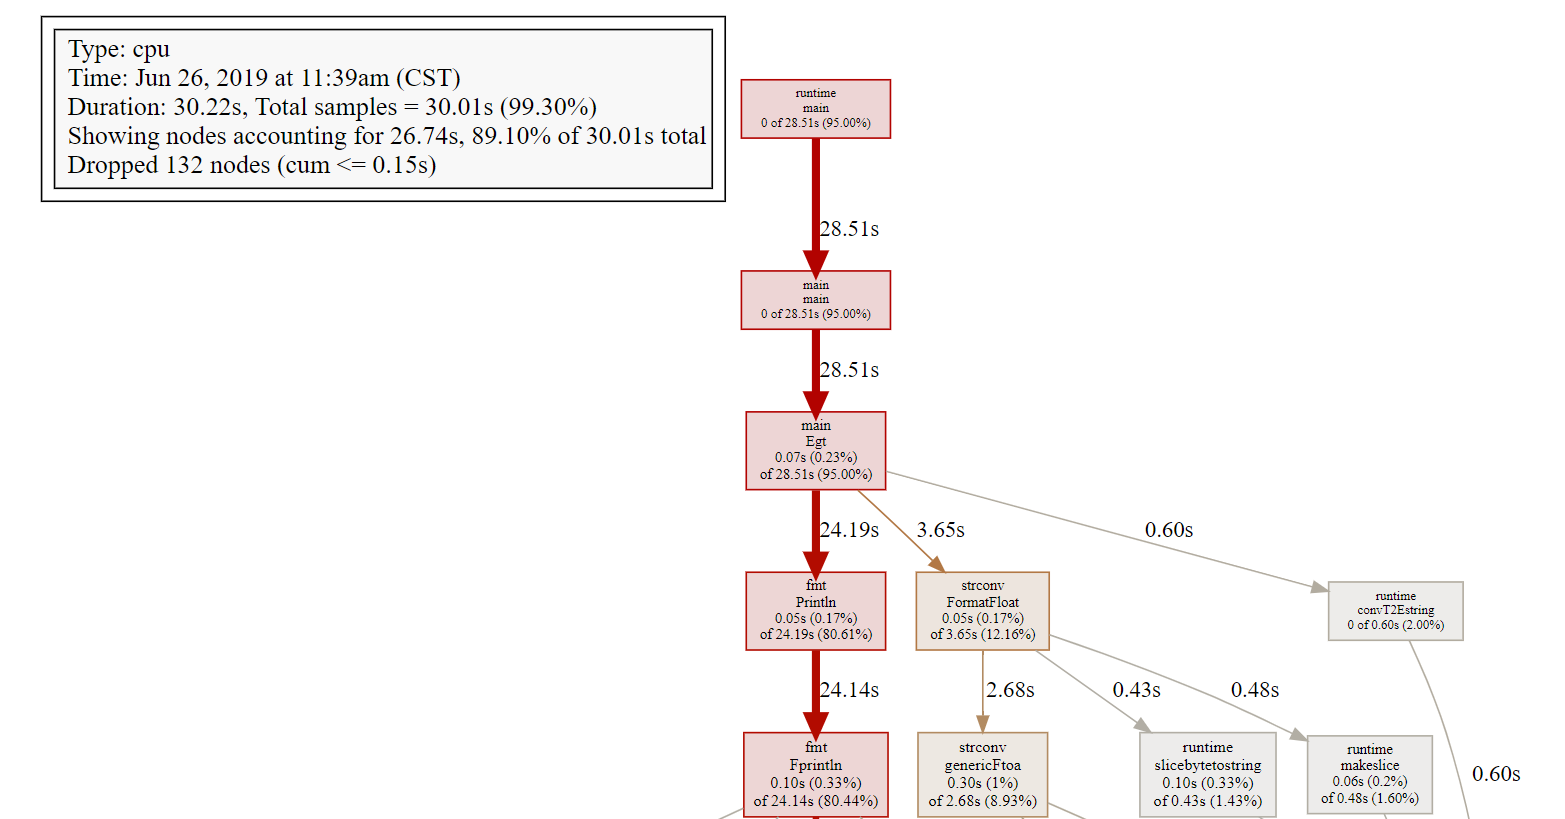
pprof 定位 CPU 占用的问题就结束了,你只需要输入 exit 退出 pprof 的交互式终端。
内存占用过高
程序案例代码
1
2
3
4
5
6
7
8
9
10
11
12
13
14
15
16
17
18
19
20
21
22
23
24
25
26
27
28
29
30
31
32
33
34
35
36
37
38
39
40
41
42package main
import (
"log"
"net/http"
_ "net/http/pprof"
"os"
"runtime"
"time"
)
func main() {
// 限制 CPU 使用数,避免过载
runtime.GOMAXPROCS(1)
// 开启对锁调用的跟踪
runtime.SetMutexProfileFraction(1)
// 开启对阻塞操作的跟踪
runtime.SetBlockProfileRate(1)
go func() {
// 启动一个 http server
if err := http.ListenAndServe(":8080", nil); err != nil {
log.Fatal(err)
}
os.Exit(0)
}()
Memory()
}
var buffer [][1024]byte
func Memory() {
// 最大内存为1G
max := 1024*1024*1024
for len(buffer)*1024 < max {
buffer = append(buffer, [1024]byte{})
}
log.Println("设置异常内存完毕")
for{
time.Sleep(time.Second)
}
}
执行采集内存信息命令:go tool pprof -cum http://127.0.0.1:8080/debug/pprof/heap
1. -inuse_space:(推荐)分析应用程序的常驻内存占用情况 ,go tool pprof -inuse_space -cum http://127.0.0.1:8080/debug/pprof/heap
2. -alloc_objects:分析应用程序的内存临时分配情况,go tool pprof -alloc_objects-cum http://127.0.0.1:8080/debug/pprof/heap
1 | E:\go_project\go-pprof>go tool pprof -cum http://127.0.0.1:8080/debug/pprof/heap |
top命令,查询占用内存最高的调用1
2
3
4
5
6
7
8(pprof) top
Showing nodes accounting for 1.79GB, 100% of 1.79GB total
flat flat% sum% cum cum%
1.79GB 100% 100% 1.79GB 100% main.Memory
0 0% 100% 1.79GB 100% main.main
0 0% 100% 1.79GB 100% runtime.main
(pprof)类型 说明 flat 运行消耗内存 flat% 内存消耗总比例 sum% 累计使用 内存消耗总比例 cum 当前函数加上它之上的调用运行总内存消耗 cum% 前函数加上它之上的调用运行总内存消耗总比例 list main.Memory命令查询问题在代码的哪个位置1
2
3
4
5
6
7
8
9
10
11
12
13
14
15
16
17(pprof) list main.Memory
Total: 1.79GB
ROUTINE ======================== main.Memory in E:\go_project\go-pprof\main.go
1.79GB 1.79GB (flat, cum) 100% of Total
. . 30:var buffer [][1024]byte
. . 31:func Memory() {
. . 32: // 最大内存为1G
. . 33: max := 1024*1024*1024
. . 34: for len(buffer)*1024 < max {
1.79GB 1.79GB 35: buffer = append(buffer, [1024]byte{})
. . 36: }
. . 37: log.Println("设置异常内存完毕")
. . 38: for{
. . 39: time.Sleep(time.Second)
. . 40: }
(pprof)问题出现在35行,原因是循环的向
buffer追加数据web命令使用浏览器图形工具查看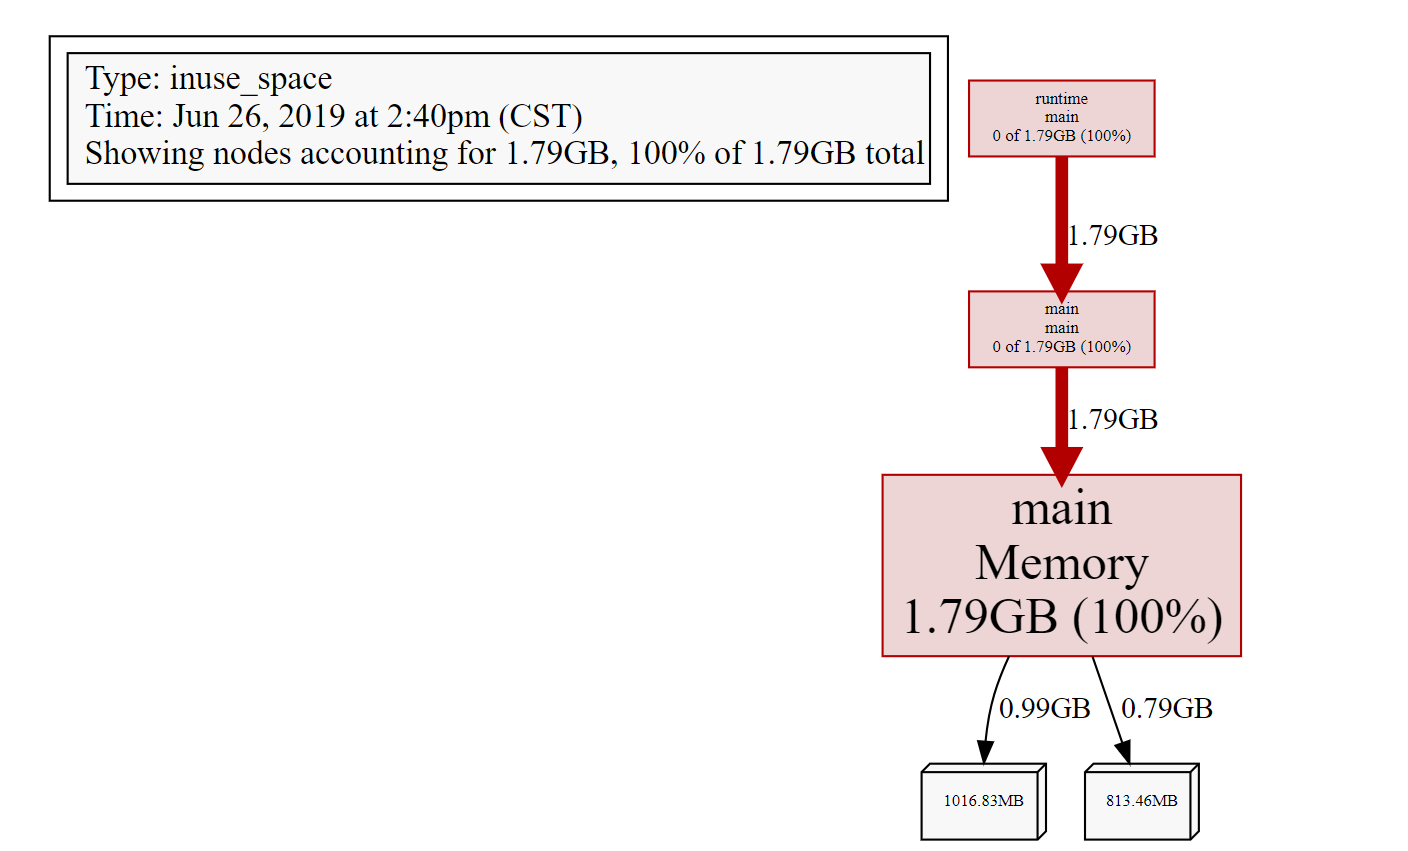
pprof 定位 内存占用的问题就结束了,你只需要输入 exit 退出 pprof 的交互式终端。
频繁GC回收
实例代码
1 | package main |
启动pprof命令:
go tool pprof -cum http://127.0.0.1:8080/debug/pprof/allocs1
2
3
4
5
6
7
8E:\go_project\go-pprof>go tool pprof -cum http://127.0.0.1:8080/debug/pprof/allocs
Fetching profile over HTTP from http://127.0.0.1:8080/debug/pprof/allocs
Saved profile in C:\Users\chc_golang\pprof\pprof.alloc_objects.alloc_space.inuse_objects.inuse_space.021.pb.gz
Type: alloc_space
Time: Jun 26, 2019 at 3:22pm (CST)
Entering interactive mode (type "help" for commands, "o" for options)
(pprof)top命令1
2
3
4
5
6
7
8
9(pprof) top
Showing nodes accounting for 45.86GB, 100% of 45.86GB total
Dropped 15 nodes (cum <= 0.23GB)
flat flat% sum% cum cum%
45.86GB 100% 100% 45.86GB 100% main.MemoryGc
0 0% 100% 45.86GB 100% main.main
0 0% 100% 45.86GB 100% runtime.main
(pprof)list命令1
2
3
4
5
6
7
8
9
10
11
12
13
14
15
16(pprof) list main.MemoryGc
Total: 45.86GB
ROUTINE ======================== main.MemoryGc in E:\go_project\go-pprof\main.go
45.86GB 45.86GB (flat, cum) 100% of Total
. . 32:
. . 33:}
. . 34:func MemoryGc() {
. . 35:
. . 36: for {
45.86GB 45.86GB 37: _ = make([]byte, 16 * 1024 * 1024)
. . 38: time.Sleep(100*time.Millisecond)
. . 39: }
. . 40:
. . 41:}
(pprof)可以看出37行进行无意义的内存申请导致频繁gc
但是如果将
_ = make([]byte, 16 * 1024 * 1024)内存申请改成较小的值,则不会出现频繁gc原因是在 golang 里,对象是使用堆内存还是栈内存,由编译器进行逃逸分析并决定,如果对象不会逃逸,便可在使用栈内存,但总有意外,就是对象的尺寸过大时,便不得不使用堆内存。所以这里设置申请 16 MiB 的内存就是为了避免编译器直接在栈上分配,如果那样得话就不会涉及到 GC 了。
web命令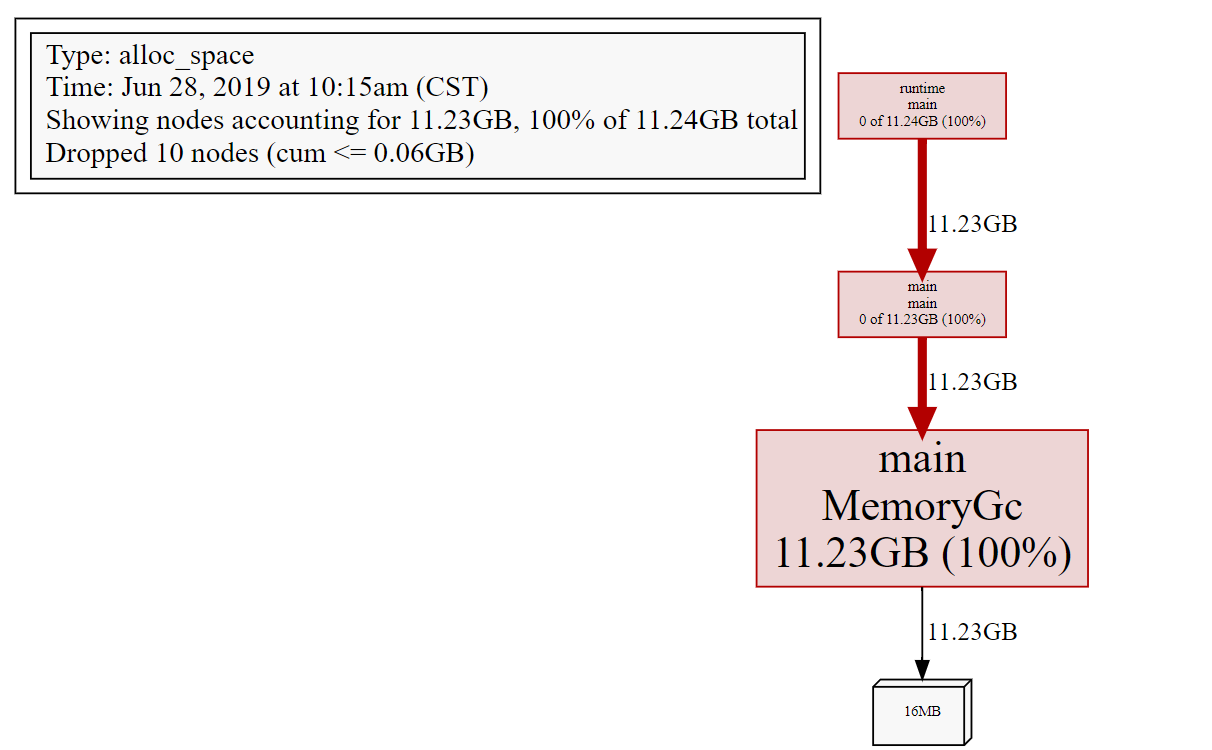
协程泄露
由于 golang 自带内存回收,所以一般不会发生内存泄露。但凡事都有例外,在 golang 中,协程本身是可能泄露的,或者叫协程失控,进而导致内存泄露。
程序代码示例
1 | package main |
启动pprof命令:
go tool pprof -cum http://127.0.0.1:8080/debug/pprof/goroutine1
2
3
4
5
6
7E:\go_project\go-pprof>go tool pprof -cum http://127.0.0.1:8080/debug/pprof/goroutine
Fetching profile over HTTP from http://127.0.0.1:8080/debug/pprof/goroutine
Saved profile in C:\Users\chc_golang\pprof\pprof.goroutine.002.pb.gz
Type: goroutine
Time: Jun 26, 2019 at 5:06pm (CST)
Entering interactive mode (type "help" for commands, "o" for options)
(pprof)top命令1
2
3
4
5
6
7
8
9
10
11
12
13
14
15
16(pprof) top
Showing nodes accounting for 32, 94.12% of 34 total
Showing top 10 nodes out of 31
flat flat% sum% cum cum%
32 94.12% 94.12% 32 94.12% runtime.gopark
0 0% 94.12% 31 91.18% runtime.goparkunlock
0 0% 94.12% 31 91.18% time.Sleep
0 0% 94.12% 30 88.24% main.Thread.func1
0 0% 94.12% 1 2.94% internal/poll.(*FD).Accept
0 0% 94.12% 1 2.94% internal/poll.(*FD).acceptOne
0 0% 94.12% 1 2.94% internal/poll.(*ioSrv).ExecIO
0 0% 94.12% 1 2.94% internal/poll.(*pollDesc).wait
0 0% 94.12% 1 2.94% internal/poll.runtime_pollWait
0 0% 94.12% 1 2.94% main.main
(pprof)list main.Thread.func11
2
3
4
5
6
7
8
9
10
11
12
13
14
15
16
17(pprof) list main.Thread.func1
Total: 34
ROUTINE ======================== main.Thread.func1 in E:\go_project\go-pprof\main.go
0 30 (flat, cum) 88.24% of Total
. . 34:func Thread() {
. . 35:
. . 36: for i := 0; i < 30; i++ {
. . 37: go func() {
. . 38: for {
. 30 39: time.Sleep(30*time.Second)
. . 40: }
. . 41: }()
. . 42: }
. . 43:
. . 44:}
(pprof)问题出现在
Thread方法创建无用的goroutineweb命令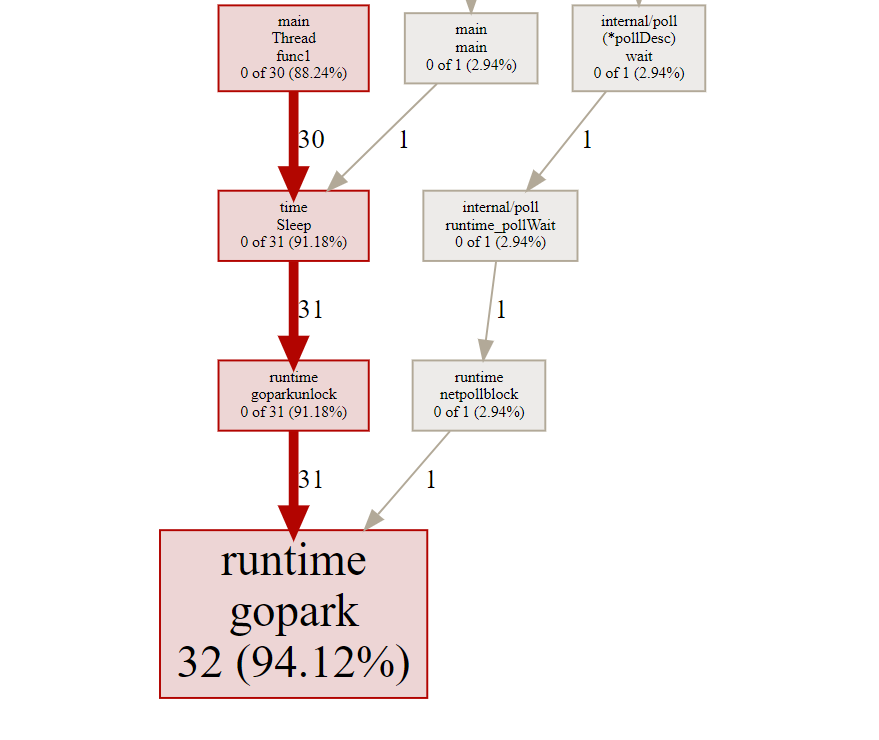
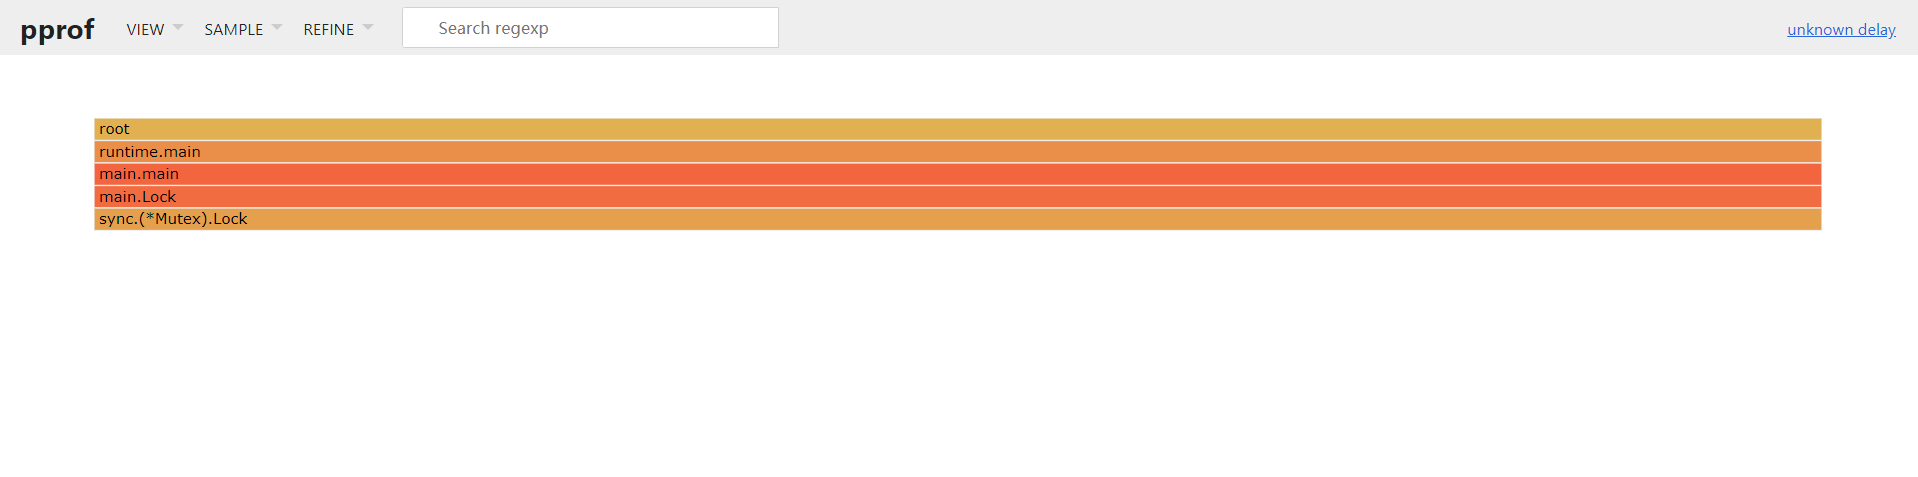
锁的竞争
实例代码
1 | package main |
执行pprof命令:go tool pprof -cum http://127.0.0.1:8080/debug/pprof/mutex
1 | E:\go_project\go-pprof>go tool pprof -cum http://127.0.0.1:8080/debug/pprof/mutex |
top命令1
2
3
4
5
6(pprof) top
Showing nodes accounting for 10.04s, 100% of 10.04s total
flat flat% sum% cum cum%
0 0% 0% 10.04s 100% main.Lock.func1
10.04s 100% 100% 10.04s 100% sync.(*Mutex).Unlocklist命令1
2
3
4
5
6
7
8
9
10
11
12
13
14
15
16(pprof) list main.Lock.func1
Total: 10.04s
ROUTINE ======================== main.Lock.func1 in E:\go_project\go-pprof\main.go
0 10.04s (flat, cum) 100% of Total
. . 36:
. . 37: m := &sync.Mutex{}
. . 38: m.Lock()
. . 39: go func() {
. . 40: time.Sleep(10*time.Second)
. 10.04s 41: m.Unlock()
. . 42: }()
. . 43: m.Lock()
. . 44:
. . 45:}
(pprof)可以看出造成锁等待10秒的问题出现在哪
web命令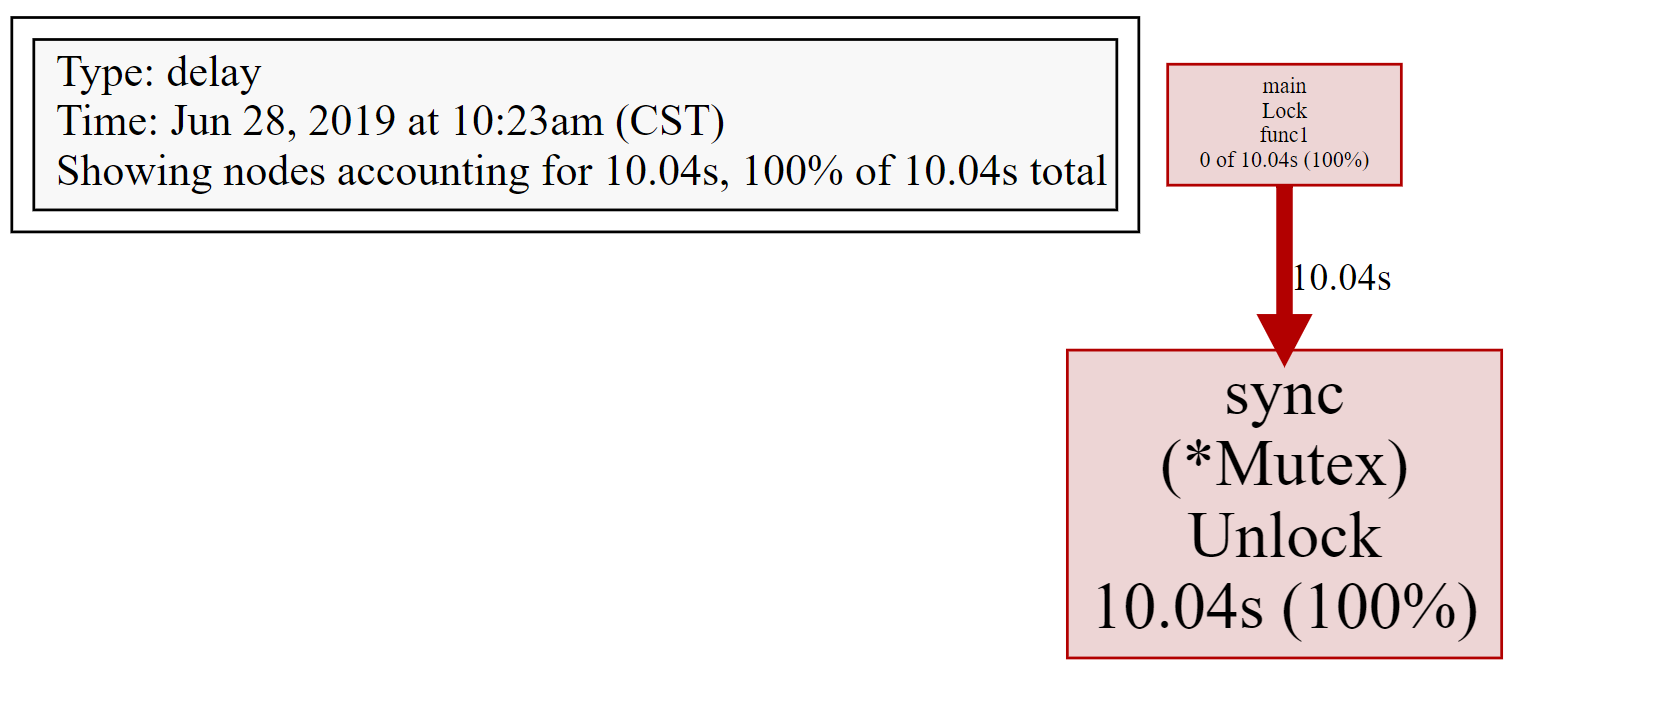
查看历史调试记录
执行pprof命令后会生成一个
pb.gz文件1
2
3
4
5
6
7E:\go_project\go-pprof>go tool pprof -cum http://127.0.0.1:8080/debug/pprof/goroutine
Fetching profile over HTTP from http://127.0.0.1:8080/debug/pprof/goroutine
Saved profile in C:\Users\chc_golang\pprof\pprof.goroutine.003.pb.gz
Type: goroutine
Time: Jun 26, 2019 at 9:05pm (CST)
Entering interactive mode (type "help" for commands, "o" for options)执行
go tool pprof [*.gz]则可以加载历史记录1
2
3
4
5
6E:\go_project\go-pprof>go tool pprof C:\Users\chc_golang\pprof\pprof.goroutine.003.pb.gz
Type: goroutine
Time: Jun 26, 2019 at 9:05pm (CST)
Entering interactive mode (type "help" for commands, "o" for options)
(pprof)可以执行
top,list等pprof的调试命令1
2
3
4
5
6
7
8
9
10
11
12
13
14
15
16
17
18
19
20
21
22
23
24
25
26
27
28
29
30
31
32
33
34
35E:\go_project\go-pprof>go tool pprof C:\Users\chc_golang\pprof\pprof.goroutine.003.pb.gz
Type: goroutine
Time: Jun 26, 2019 at 9:05pm (CST)
Entering interactive mode (type "help" for commands, "o" for options)
(pprof) top
Showing nodes accounting for 34, 100% of 34 total
Showing top 10 nodes out of 31
flat flat% sum% cum cum%
32 94.12% 94.12% 32 94.12% runtime.gopark
1 2.94% 97.06% 1 2.94% net/http.(*connReader).backgroundRead
1 2.94% 100% 1 2.94% runtime/pprof.writeRuntimeProfile
0 0% 100% 1 2.94% internal/poll.(*FD).Accept
0 0% 100% 1 2.94% internal/poll.(*FD).acceptOne
0 0% 100% 1 2.94% internal/poll.(*ioSrv).ExecIO
0 0% 100% 1 2.94% internal/poll.(*pollDesc).wait
0 0% 100% 1 2.94% internal/poll.runtime_pollWait
0 0% 100% 30 88.24% main.Thread.func1
0 0% 100% 1 2.94% main.main
(pprof) list main.Thread.func1
Total: 34
ROUTINE ======================== main.Thread.func1 in E:\go_project\go-pprof\main.go
         0         30 (flat, cum) 88.24% of Total
         .          .     34:func Thread()  {
         .          .     35:
         .          .     36:   for i := 0; i < 30; i++ {
         .          .     37:           go func() {
         .          .     38:                   for   {
         .         30     39:                           time.Sleep(30*time.Second)
         .          .     40:                   }
         .          .     41:           }()
         .          .     42:   }
         .          .     43:
         .          .     44:}
(pprof)
PProf 火焰图工具(推荐)
安装
1 | go get -u github.com/google/pprof |
使用方式
使用命令与官方的pprof一样,只不过将go tool pprof换成pprof
另外如果加上-http的功能可以使用交互终端,直接使用浏览器操作查看
执行启动命令
pprof -http=:8081 http://127.0.0.1:8080/debug/pprof/block或者pprof -http:8081 C:\Users\chc_golang\pprof\pprof.contentions.delay.007.pb.gz1
2
3
4E:\go_project\go-pprof>pprof -http=:8081 http://127.0.0.1:8080/debug/pprof/block
Fetching profile over HTTP from http://127.0.0.1:8080/debug/pprof/block
Saved profile in C:\Users\chc_golang\pprof\pprof.contentions.delay.010.pb.gz
Serving web UI on http://localhost:8081浏览器输入
http://127.0.0.1:8081top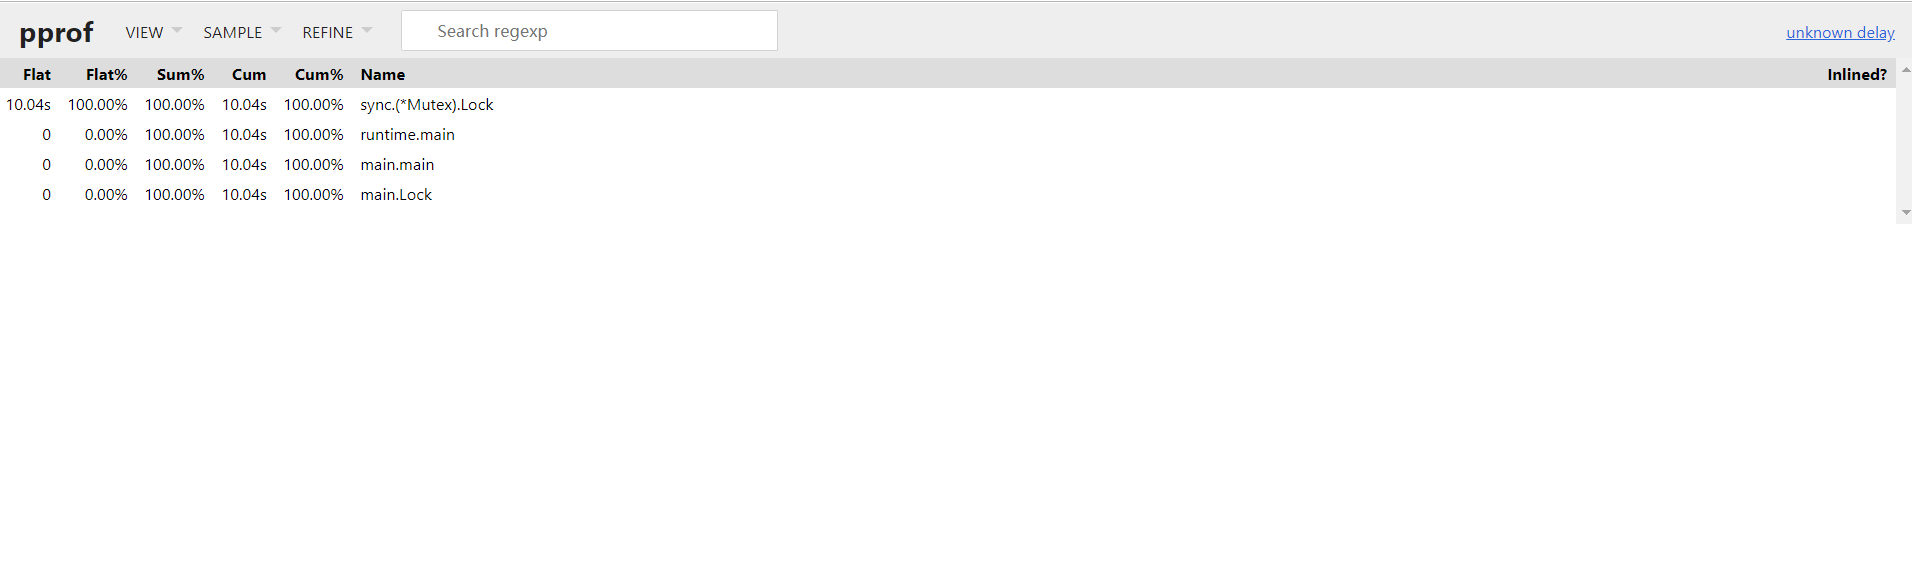
list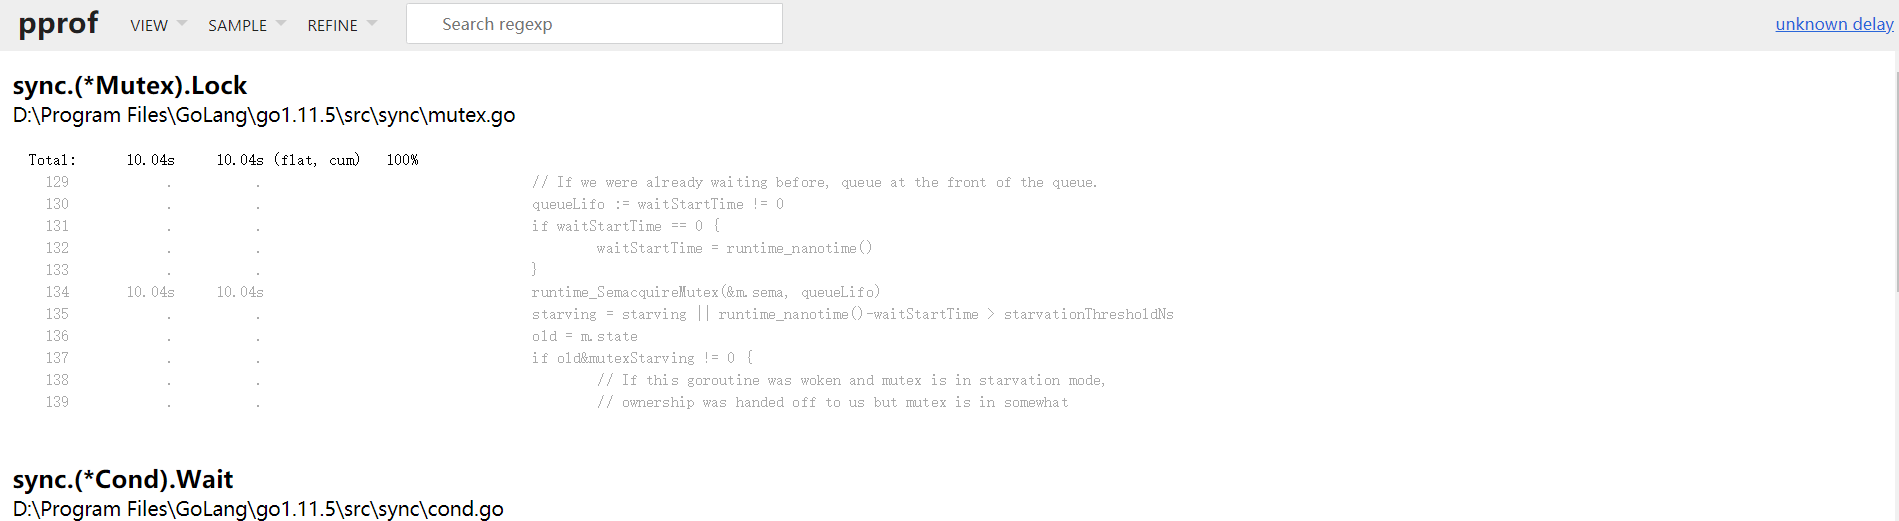
web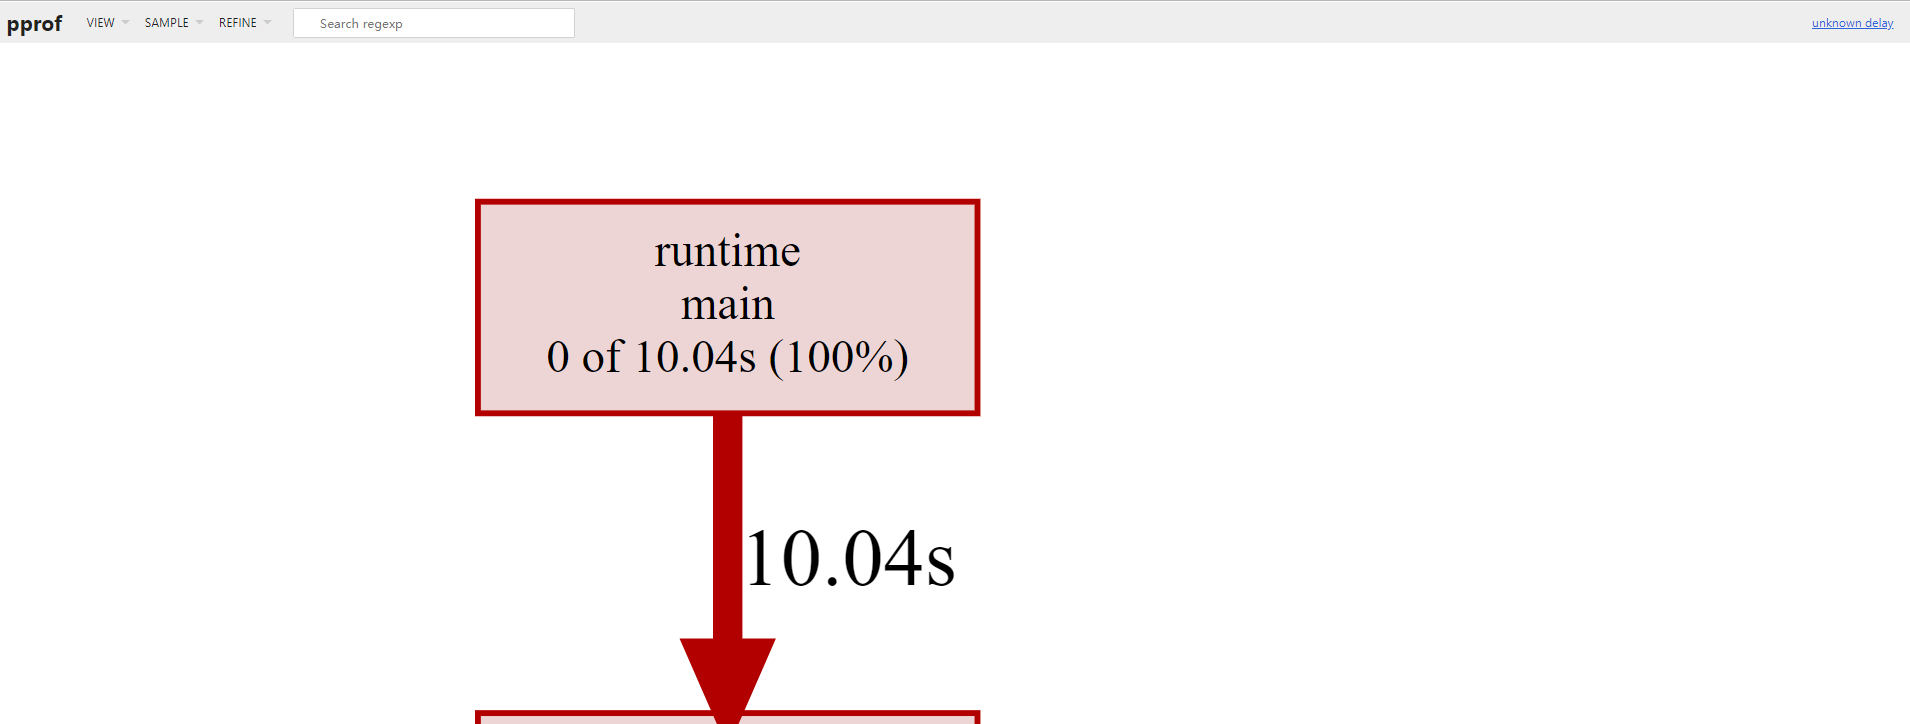
新特性火焰图
最后
pprof的基本使用就到这里了
还有一个trace因为较为复杂,现在还没完全掌握