
JVM性能监控与调优
一. JDK命令行工具监控
0. 命令文档地址
https://docs.oracle.com/javase/8/docs/technotes/tools/unix/index.html
1. XX参数分类
- Boolean类型

- 非Boolean类型

- -Xmx -Xms(最大内存,最小内存)
- -Xms等价于-XX.InitialHeapSize
- -Xmx等价于-XX:MaxHeapSize
2. 查看JVM运行时参数
- -XX:+PrintFlagslnitial 查看初始值情况
- -XX:+PrintFlagsFinal 查看最终值
- -XX:+UnlockExperimentalVMOptions 解锁实验参数
- -XX:+UnlockDiagnosticVMOptions 解锁诊断参数
- -xx:+PrintCommandLineFlags 打印命令行参数
2.1 PrintFlagsFinal
- =表示默认值, :=被用户或者JVM修改后的值
1
java -XX:+PrintFlagsFinal -version
2.2 jps
https://docs.oracle.com/javase/8/docs/technotes/tools/unix/jps.html - jps用法
1
2
# hostid 命令对应的服务器ip,默认不加参数,代码查看本机
jps [参数] [<hostid>] - jps参数
1
2
3
4
5
-q:只输出进程 ID
-m:输出传入 main 方法的参数
-l:输出完全的包名,应用主类名,jar的完全路径名
-v:输出jvm参数
-V:输出通过flag文件传递到JVM中的参数
2.3 jinfo
- 功能
- 查看JVM参数(常用)
- 查看系统参数,即可通过System.getProperty(key)获得的参数(常用)
- 修改JVM参数(少用)
- 使用命令
- 分析pid
1
2
jinfo [option] {pid}
# pid: 可通过jps或者ps获得 - 分析core dump文件
1
2
3
4
jinfo [option] {executable} {core}
# executable: The Java executable from which the core dump was produced.
# core: The core file for which the configuration information is to be printed. - 分析远程进程
1
2
3
jinfo [option] [ server-id ] {remote-hostname-or-IP}
# server-id: An optional unique ID to use when multiple debug servers are running on the same remote host.
# remote-hostname-or-IP: 远程服务的IP或者hostname
- 分析pid
- option可选值
- no-option:即,没有任何option。会打印所有的JVM参数和系统参数。等同于-flags + -sysprops
- -flag {name} : 打印指定的JVM参数值。
1
2
jinfo -flag SurvivorRatio 55394
# 结果为: -XX:SurvivorRatio=8 - -flag [+|-]name : enables or disables指定的VM参数,也就是使指定的VM参数生效或者失效
1
2
jinfo -flag -PrintGCDateStamps 12905
# 结果为:使PrintGCDateStamps失效 - -flag name=value : 为指定的VM参数(name)设置指定的值(value)
1
2
3
jinfo -flag MaxHeapFreeRatio=80 12905
# 再通过jinfo -flag MaxHeapFreeRatio 12905查看其值
# 结果为: -XX:MaxHeapFreeRatio=80 - -flags : 打印所有的VM参数
1
2
Non-default VM flags: -XX:CICompilerCount=2 -XX:CMSFullGCsBeforeCompaction=0 -XX:CMSInitiatingOccupancyFraction=80 -XX:+DisableExplicitGC -XX:ErrorFile=null -XX:+HeapDumpOnOutOfMemoryError -XX:HeapDumpPath=null -XX:InitialCodeCacheSize=134217728 -XX:InitialHeapSize=1073741824 -XX:MaxHeapSize=1073741824 -XX:MaxMetaspaceSize=268435456 -XX:MaxNewSize=268435456 -XX:MinHeapDeltaBytes=196608 -XX:NewSize=268435456 -XX:OldPLABSize=16 -XX:OldSize=805306368 -XX:+PrintGC -XX:+PrintGCDateStamps -XX:+PrintGCDetails -XX:+PrintGCTimeStamps -XX:+PrintHeapAtGC -XX:+PrintTenuringDistribution -XX:ReservedCodeCacheSize=134217728 -XX:SurvivorRatio=8 -XX:+UseCMSCompactAtFullCollection -XX:+UseCompressedClassPointers -XX:+UseCompressedOops -XX:+UseConcMarkSweepGC -XX:+UseFastUnorderedTimeStamps -XX:+UseParNewGC
Command line: -Dfile.encoding=UTF-8 -Dsun.jnu.encoding=UTF-8 -Djava.io.tmpdir=/opt/micheal/tmp -Djava.net.preferIPv6Addresses=false -DLog4jContextSelector=org.apache.logging.log4j.core.async.AsyncLoggerContextSelector -Xmx1g -Xms1g -Xmn256m -XX:SurvivorRatio=8 -XX:MaxMetaspaceSize=256m -XX:+HeapDumpOnOutOfMemoryError -XX:ReservedCodeCacheSize=128m -XX:InitialCodeCacheSize=128m -XX:+DisableExplicitGC -XX:+PrintGCDetails -XX:+PrintHeapAtGC -XX:+PrintTenuringDistribution -XX:+UseConcMarkSweepGC -XX:+PrintGCTimeStamps -XX:+PrintGCDateStamps -XX:CMSFullGCsBeforeCompaction=0 -XX:+UseCMSCompactAtFullCollection -XX:CMSInitiatingOccupancyFraction=80 -Xloggc:/opt/logs/mobile/xm.test.read/xm.test.read.gc.log -XX:ErrorFile=/opt/logs/mobile/xm.test.read/xm.test.read.vmerr.log -XX:HeapDumpPath=/opt/logs/mobile/xm.test.read/xm.test.read.heaperr.log -Djetty.appkey=xm.test.read -Djetty.context=/ -Djetty.logs=/opt/logs/mobile/xm.test.read -Djetty.webroot=/opt/micheal/mobile/xm.test.read/webroot - -sysprops : 打印系统参数
1
jinfo -sysprops 12905
- -h : 帮助信息
查看最大内存
1
2
# 1292为进程Id
jinfo -flag MaxHeapSize 1292查看垃圾回收器
1
2
3
4
# 1292为进程Id
jinfo -flag UseG1GC 1292
jinfo -flag UseConcMarkSweepGC 1292
jinfo -flag UseParallelGC 12922.4 jstat查看JVM统计信息
用法
1
2
3
4
5
6
7
jstat -<option> [-t] [-h<lines>] <vmid> [<interval> [<count>]]
# option: 参数选项
# -t: 可以在打印的列加上Timestamp列,用于显示系统运行的时间
# -h: 可以在周期性数据数据的时候,可以在指定输出多少行以后输出一次表头
# vmid: Virtual Machine ID( 进程的 pid)
# interval: 执行每次的间隔时间,单位为毫秒
# count: 用于指定输出多少次记录,缺省则会一直打印option参数
参数 作用 -class 显示ClassLoad的相关信息; -compiler 显示JIT编译的相关信息; -gc 显示和gc相关的堆信息; -gccapacity 显示各个代的容量以及使用情况; -gcmetacapacity 显示metaspace的大小 -gcnew 显示新生代信息; -gcnewcapacity 显示新生代大小和使用情况; -gcold 显示老年代和永久代的信息; -gcoldcapacity 显示老年代的大小; -gcutil 显示垃圾收集信息; -gccause 显示垃圾回收的相关信息(通-gcutil),同时显示最后一次或当前正在发生的垃圾回收的诱因; -printcompilation 输出JIT编译的方法信息; 类加载 -class
1
jstat -class <pid>
结果字段 说明 Loaded 已经装载的类的数量 Bytes 装载类所占用的字节数 Unloaded 已经卸载类的数量 Bytes 卸载类的字节数 Time 装载和卸载类所花费的时间 -compiler 显示VM实时编译(JIT)的数量信息
1
jstat -compiler <pid>
结果字段 说明 Compiled 编译任务执行数量 Failed 编译任务执行失败数量 Invalid 编译任务执行失效数量 Time 编译任务消耗时间 FailedType 最后一个编译失败任务的类型 FailedMethod 最后一个编译失败任务所在的类及方法 -gc 垃圾收集
1
2
# -gc,-gcutil,-gccause,-gcnew,-gcold
jstat -gc <pid>结果字段 说明 S0C 年轻代中第一个survivor(幸存区)的容量 (字节) S1C 年轻代中第二个survivor(幸存区)的容量 (字节) S0U 年轻代中第一个survivor(幸存区)目前已使用空间 (字节) S1U 年轻代中第二个survivor(幸存区)目前已使用空间 (字节) EC 年轻代中Eden(伊甸园)的容量 (字节) EU 年轻代中Eden(伊甸园)目前已使用空间 (字节) OC Old代的容量 (字节) OU Old代目前已使用空间 (字节) MC metaspace(元空间)的容量 (字节) MU metaspace(元空间)目前已使用空间 (字节) YGC 从应用程序启动到采样时年轻代中gc次数 YGCT 从应用程序启动到采样时年轻代中gc所用时间(s) FGC 从应用程序启动到采样时old代(全gc)gc次数 FGCT 从应用程序启动到采样时old代(全gc)gc所用时间(s) GCT 从应用程序启动到采样时gc用的总时间(s) CCSC 压缩类空间总量(字节) CCSU 压缩类空间使用量(字节) -gccapacity VM内存中三代(young,old,perm)对象的使用和占用大小
1
jstat -gccapacity <pid>
结果字段 说明 NGCMN 年轻代(young)中初始化(最小)的大小(字节) NGCMX 年轻代(young)的最大容量 (字节) NGC 年轻代(young)中当前的容量 (字节) S0C 年轻代中第一个survivor(幸存区)的容量 (字节) S1C 年轻代中第二个survivor(幸存区)的容量 (字节) EC 年轻代中Eden(伊甸园)的容量 (字节) OGCMN old代中初始化(最小)的大小 (字节) OGCMX old代的最大容量(字节) OGC old代当前新生成的容量 (字节) OC Old代的容量 (字节) MCMN metaspace(元空间)中初始化(最小)的大小 (字节) MCMX metaspace(元空间)的最大容量 (字节) MC metaspace(元空间)当前新生成的容量 (字节) CCSMN 最小压缩类空间大小 CCSMX 最大压缩类空间大小 CCSC 当前压缩类空间大小 YGC 从应用程序启动到采样时年轻代中gc次数 FGC 从应用程序启动到采样时old代(全gc)gc次数 -gcmetacapacity metaspace中对象的信息及其占用量。
1
jstat -gcmetacapacity <pid>
结果字段 说明 MCMN 最小元数据容量 MCMX 最大元数据容量 MC 当前元数据空间大小 CCSMN 最小压缩类空间大小 CCSMX 最大压缩类空间大小 CCSC 当前压缩类空间大小 YGC 从应用程序启动到采样时年轻代中gc次数 FGC 从应用程序启动到采样时old代(全gc)gc次数 FGCT 从应用程序启动到采样时old代(全gc)gc所用时间(s) GCT 从应用程序启动到采样时gc用的总时间(s) -gcnew 年轻代对象的信息。
1
jstat -gcnew <pid>
结果字段 说明 S0C 年轻代中第一个survivor(幸存区)的容量 (字节) S1C 年轻代中第二个survivor(幸存区)的容量 (字节) S0U 年轻代中第一个survivor(幸存区)目前已使用空间 (字节) S1U 年轻代中第二个survivor(幸存区)目前已使用空间 (字节) TT 持有次数限制 MTT 最大持有次数限制 DSS 期望的幸存区大小 EC 年轻代中Eden(伊甸园)的容量 (字节) EU 年轻代中Eden(伊甸园)目前已使用空间 (字节) YGC 从应用程序启动到采样时年轻代中gc次数 YGCT 从应用程序启动到采样时年轻代中gc所用时间(s) -gcnewcapacity 年轻代对象的信息及其占用量
结果字段 说明 NGCMN 年轻代(young)中初始化(最小)的大小(字节) NGCMX 年轻代(young)的最大容量 (字节) NGC 年轻代(young)中当前的容量 (字节) S0CMX 年轻代中第一个survivor(幸存区)的最大容量 (字节) S0C 年轻代中第一个survivor(幸存区)的容量 (字节) S1CMX 年轻代中第二个survivor(幸存区)的最大容量 (字节) S1C 年轻代中第二个survivor(幸存区)的容量 (字节) ECMX 年轻代中Eden(伊甸园)的最大容量 (字节) EC 年轻代中Eden(伊甸园)的容量 (字节) YGC 从应用程序启动到采样时年轻代中gc次数 FGC 从应用程序启动到采样时old代(全gc)gc次数 -gcold old代对象的信息
1
jstat -gcold <pid>
结果字段 说明 MC metaspace(元空间)的容量 (字节) MU metaspace(元空间)目前已使用空间 (字节) CCSC 压缩类空间大小 CCSU 压缩类空间使用大小 OC Old代的容量 (字节) OU Old代目前已使用空间 (字节) YGC 从应用程序启动到采样时年轻代中gc次数 FGC 从应用程序启动到采样时old代(全gc)gc次数 FGCT 从应用程序启动到采样时old代(全gc)gc所用时间(s) GCT 从应用程序启动到采样时gc用的总时间(s) -gcoldcapacity old代对象的信息及其占用量
1
jstat -gcoldcapacity <pid>
结果字段 说明 OGCMN old代中初始化(最小)的大小 (字节) OGCMX old代的最大容量(字节) OGC old代当前新生成的容量 (字节) OC Old代的容量 (字节) YGC 从应用程序启动到采样时年轻代中gc次数 FGC 从应用程序启动到采样时old代(全gc)gc次数 FGCT 从应用程序启动到采样时old代(全gc)gc所用时间(s) GCT 从应用程序启动到采样时gc用的总时间(s) -gcutil 统计gc信息
1
jstat -gcutil <pid>
结果字段 说明 S0 年轻代中第一个survivor(幸存区)已使用的占当前容量百分比 S1 年轻代中第二个survivor(幸存区)已使用的占当前容量百分比 E 年轻代中Eden(伊甸园)已使用的占当前容量百分比 O old代已使用的占当前容量百分比 M 元数据的空间使用率 P perm代已使用的占当前容量百分比 YGC 从应用程序启动到采样时年轻代中gc次数 YGCT 从应用程序启动到采样时年轻代中gc所用时间(s) FGC 从应用程序启动到采样时old代(全gc)gc次数 FGCT 从应用程序启动到采样时old代(全gc)gc所用时间(s) GCT 从应用程序启动到采样时gc用的总时间(s) -gccause 显示垃圾回收的相关信息(通-gcutil),同时显示最后一次或当前正在发生的垃圾回收的诱因。
1
jstat -gccause <pid>
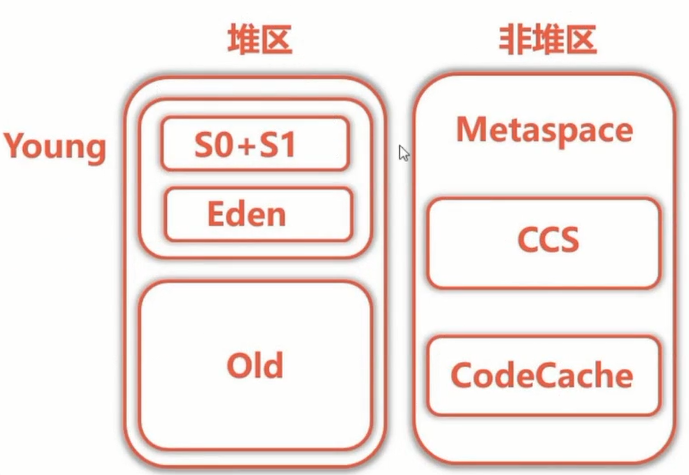
结果字段 说明 LGCC 最后一次GC原因 GCC 当前GC原因(No GC 为当前没有执行GC) 2.4 JVM的内存结构
2.5 jmap+MAT实战内存溢出
导出内存映像文件
- 内存溢出自动导出
1
2
-XX:+HeapDumpOnOutOfMemoryError
-XX:HeapDumpPath=./ - 使用jmap命令手动导出
1
jmap -dump:format=b,file=heap.hprof 1292
- 内存溢出自动导出
MAT分析内存溢出
- 下载地址 http://www.eclipse.org/mat/downloads.php 启动文件是
MemoryAnalyzer.exe打开hprof文件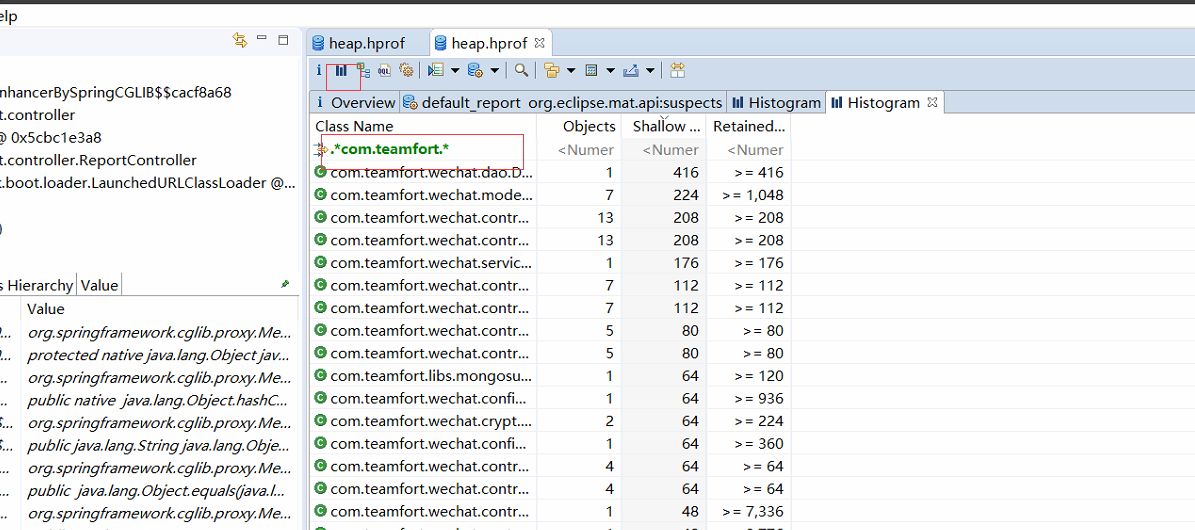
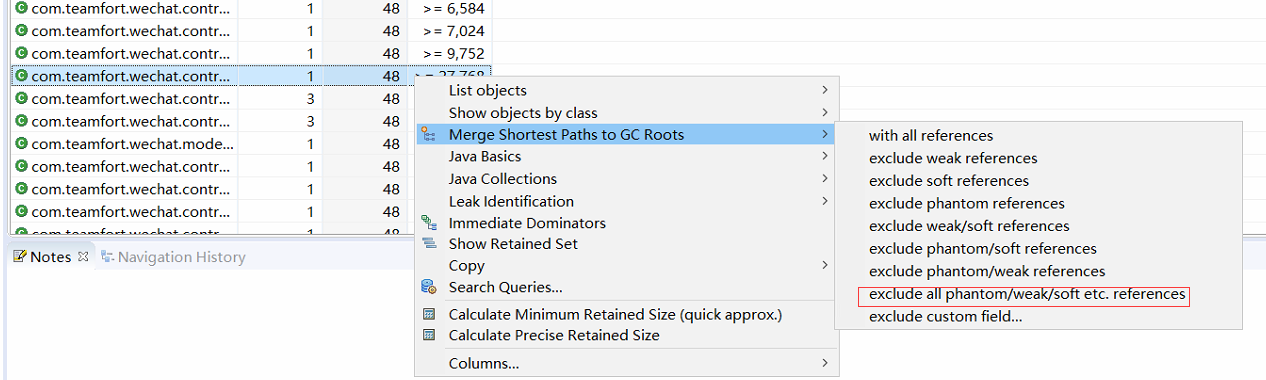
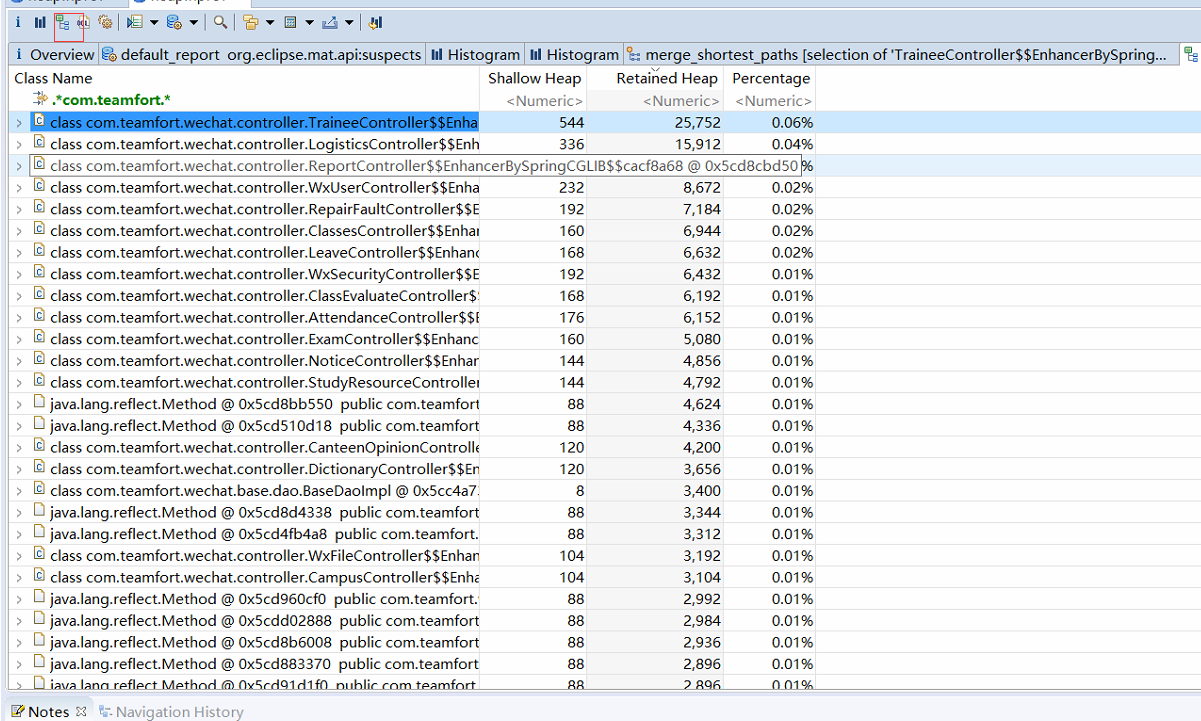
- 下载地址 http://www.eclipse.org/mat/downloads.php 启动文件是
2.5 jstack解决死循环和死锁
- 获取信息
1
2
3
4
5
6
7
jstack 1292 > 1292.txt
# 找出cpu占用高的PID
top -p 1292 -H
# 获取PID的16进制
printf "%x" 8247
# 在1292.txt文件中搜索查到的进制:2037
# 跳到nid=0x2037行
- 线程状态
1
2
3
4
5
6
7
# 1292.txt
java.lang.Thread.State: WAITING (parking)
# NEW           新建
# RUNNABLE      运行中
# WAITING       等待
# BLOCKED       阻塞
# TERMINATED    结束
- 死锁
1
2
# 拉到文件末尾
# 有deadlock就是程序定位到死锁了
三. java进程监控
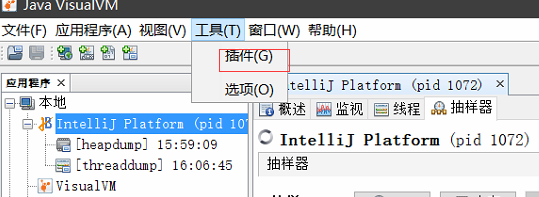
1. 基于JVisualVM的可视化监控
1. 本地监控
  1. JVisualVM程序在jdk的bin目录下jvisualvm.exe
  2. 设置插件可安装
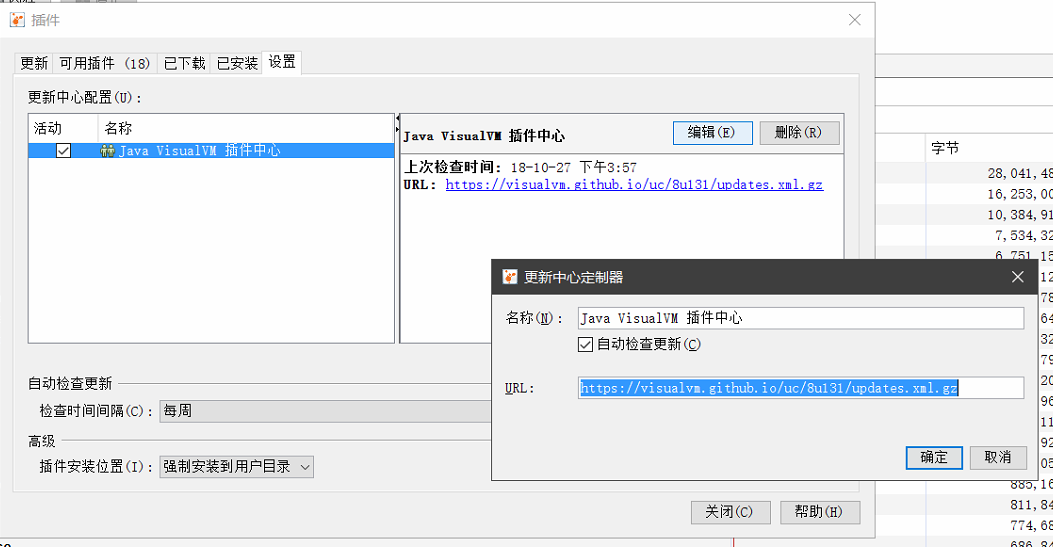
2. 安装插件
- 在下面地址中找出对应版本的
Java VisualVM地址https://visualvm.github.io/pluginscenters.html- 安装Visual GC和BTrace插件
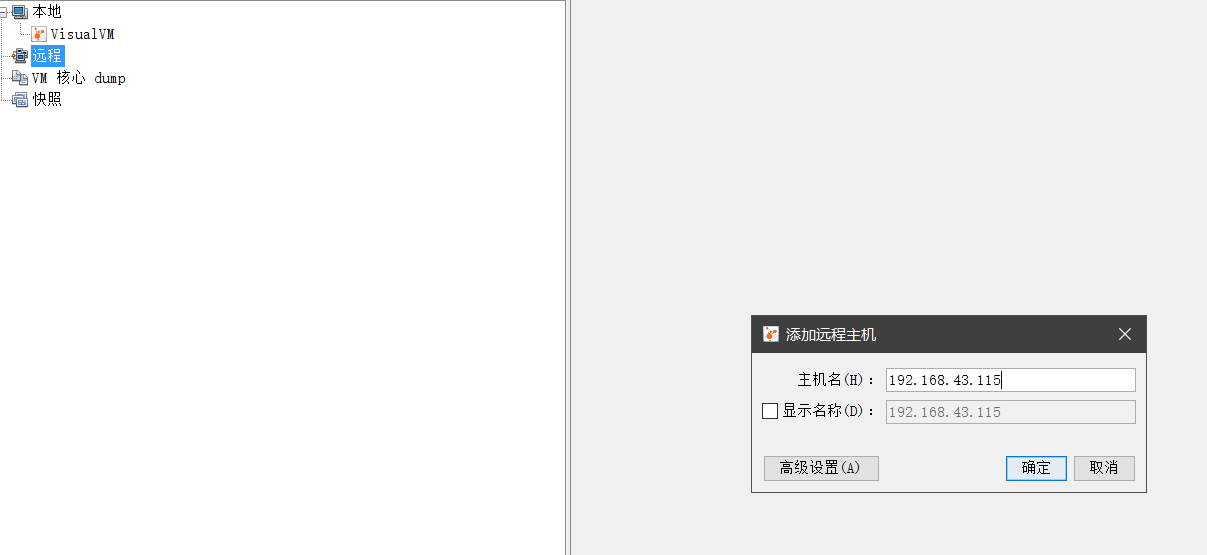
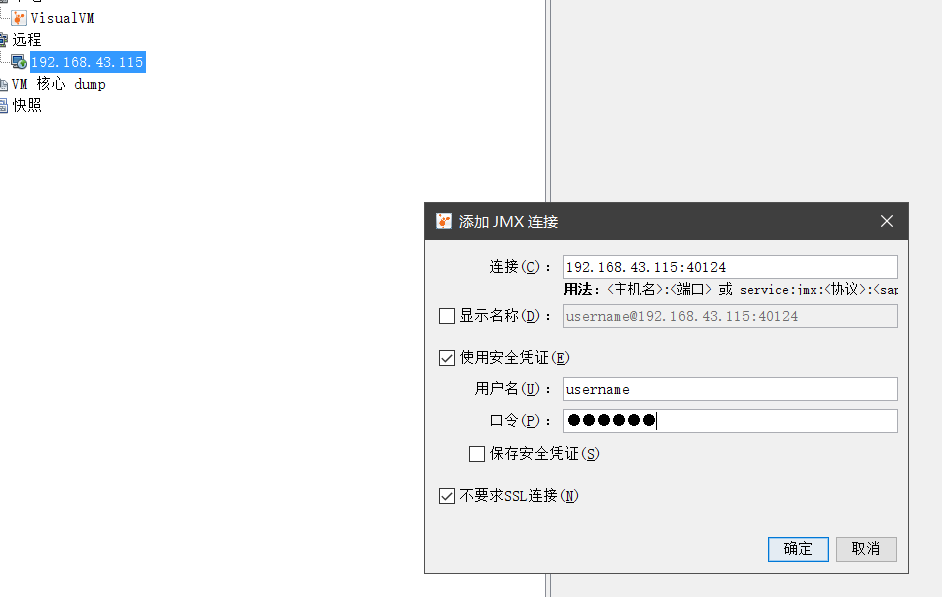
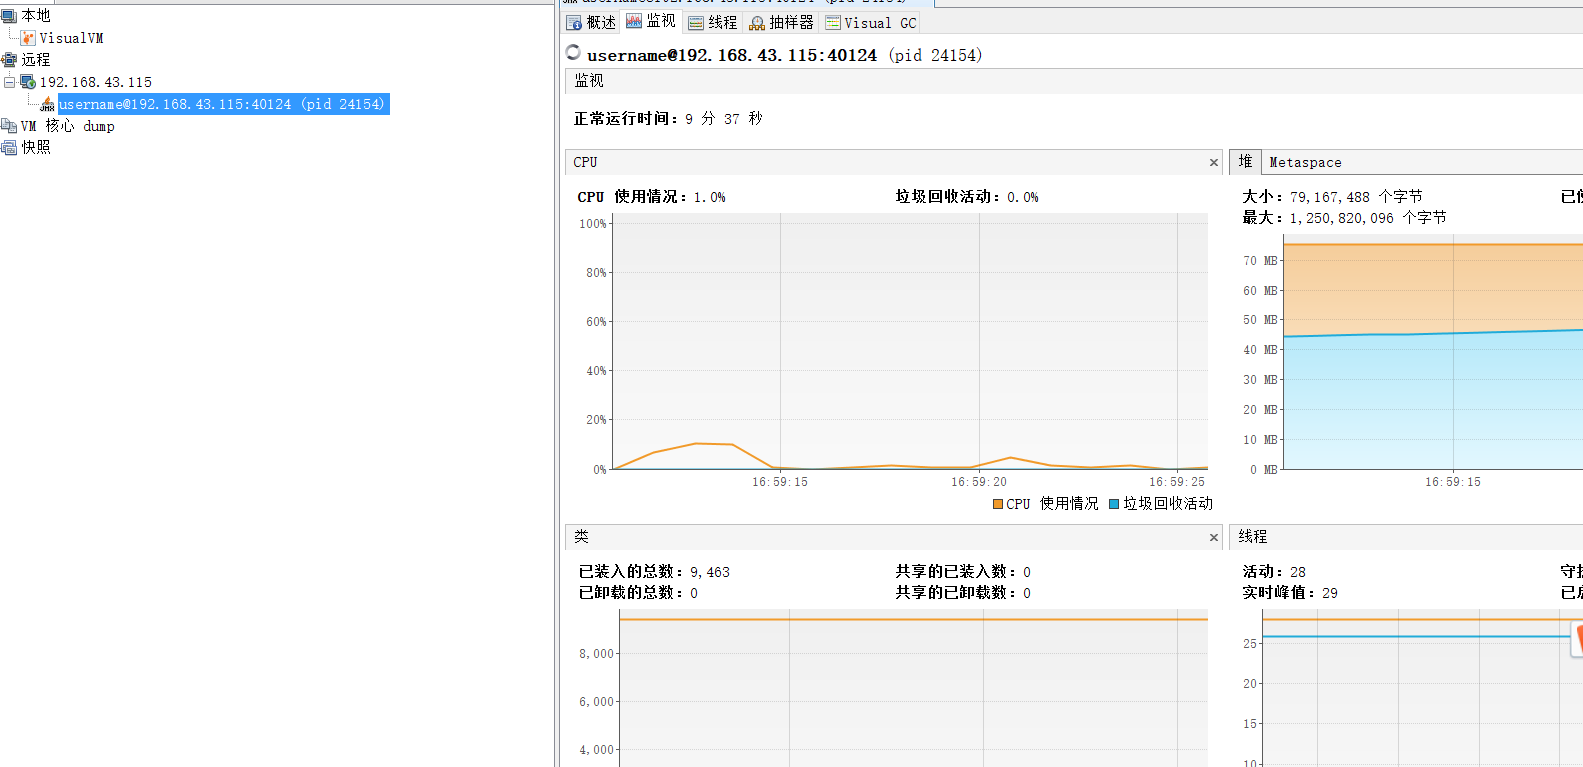
3. 远程监控
ip:192.168.43.115,jmx端口:40124
配置hostname
1
2
3
4
5
6
7
8
9
10
11
12
13
# 查询
hostname -i
# 加入hostname -i 的ip
# 与127.0.0.1 的一致
vi /etc/hosts
127.0.0.1 localhost localhost.localdomain localhost4 localhost4.localdomain4
::1 localhost localhost.localdomain localhost6 localhost6.localdomain6
192.168.43.115 localhost localhost.localdomain localhost4 localhost4.localdomain4
# 开启防火墙端口
firewall-cmd --zone=public --add-port=40124/tcp --permanent
systemctl restart firewalld.service配置授权的账号密码
1
2
3
4
5
6
7
8
9
10
# 拷贝java的jmxremote.access和jmxremote.password到程序目录下
cp JAVA_HOME/lib/management/jmxremote.access /home/project/jmxremote.access
cp JAVA_HOME/lib/management/jmxremote.password /home/project/jmxremote.password
# 在/home/project/jmxremote.access加入账号和权限
username readwrite
# 在/home/project/jmxremote.password加入密码
username password
# 修改文件权限
chmod 400 jmxremote.access
chmod 400 jmxremote.password远程jar监控
1
java -Dcom.sun.management.jmxremote -Dcom.sun.management.jmxremote.port=40124 -Dcom.sun.management.jmxremote.ssl=false -Dcom.sun.management.jmxremote.authenticate=true -Dcom.sun.management.jmxremote.access.file=./jmxremote.access -Dcom.sun.management.jmxremote.password.file=./jmxremote.password -Djava.net.preferIPv4Stack=true -Djava.rmi.server.hostname=192.168.43.115 -Dcom.sun.management.jmxremote.rmi.port=40124 -jar foot.jar
配置 类型 说明 -Dcom.sun.management.jmxremote 布尔 远程JMX访问 -Dcom.sun.management.jmxremote.port 数值 远程监控端口 -Dcom.sun.management.jmxremote.ssl 布尔 SSL加密,默认开启 -Dcom.sun.management.jmxremote.authenticate 布尔 用户认证,默认开启 -Dcom.sun.management.jmxremote.access.file 字符 对访问用户的权限授权的文件的路径,默认路径 JAVA_HOME/lib/management/jmxremote.access-Dcom.sun.management.jmxremote. password.file 字符 设置访问用户的用户名和密码,默认路径 JAVA_HOME/lib/management/jmxremote.password-Djava.net.preferIPv4Stack 布尔 ipv4方式访问,默认关闭 -Djava.rmi.server.hostname string 服务器ip或者域名 -Dcom.sun.management.jmxremote.rmi.port 数值 rmi端口 JVisualVM添加远程监控
四. Nginx
1. 基本命令
1 | # 使用default.conf配置文件,将它放入`/etc/nginx/conf.d` 中 |
2. nginx优化
1. 增加工作线程数和并发数
1 | # nginx.conf |
2. 配置Server的长连接
1 | # default.conf |
3. 配置数据压缩
1 | # nginx.conf |
4. 操作系统优化
1 | # /etc/sysctl.conf |
3. nginx配置文件
nginx.conf
1
2
3
4
5
6
7
8
9
10
11
12
13
14
15
16
17
18
19
20
21
22
23
24
25
26
27
28
29
30
31
32
33
34
35
36
37
38
39
40
41
42
43
user root;
worker_processes 1;
error_log /var/log/nginx/error.log warn;
pid /var/run/nginx.pid;
events {
worker_connections 1024;
}
http {
include /etc/nginx/mime.types;
default_type application/octet-stream;
client_max_body_size 5m;
underscores_in_headers on; #自定义 Head 必须定义
log_format main '$remote_addr - $remote_user [$time_local] "$request" '
'$status $body_bytes_sent "$http_referer" '
'"$http_user_agent" "$http_x_forwarded_for"';
access_log /var/log/nginx/access.log main;
sendfile on;
#tcp_nopush on;
keepalive_timeout 65;
gzip on;
gzip_min_length 1k;
gzip_http_version 1.0;
gzip_disable "MSIE [1-6].(?!.*SV1)";
gzip_types text/plain application/javascript application/x-javascript text/css application/xml text/javascript application/x-httpd-php image/jpeg image/gif image/png application/vnd.ms-fontobject font/ttf font/opentype font/x-woff image/svg+xml;
gzip_vary on
include /etc/nginx/conf.d/*.conf;
}default.conf
1
2
3
4
5
6
7
8
9
10
11
12
13
14
15
16
17
18
19
20
21
22
23
24
25
26
27
28
29
30
31
32
33
34
35
36
37
38
39
40
41
42
43
44
45
46
47
48
49
50
51
52
53
54
55
56
57
58
59
60
61
62
63
64
65
66
67
68
69
70
71
72
73
74
75
76
77
78
79
80
81
82
83
84
85
86
87
88
89
90
91
92
93
94
95
96
97
98
99
100
101
102
103
104
105
106
107
108
109
110
111
112
113
114
115
116
117
118
119
120
121
122
123
124
125
126
127
128
129
130
131
132
133
134
upstream teamfortWeChat { #代理配置
server 127.0.0.1:8080;
}
upstream spring-boot-admin {
server 127.0.0.1:8012;
}
upstream spring-boot-admin-test { #灰度ip发布
server 127.0.0.1:8011;
}
#server { #https配置
# listen 443;
# server_name 127.0.0.1;
# ssl on;
# root html;
# index index.html index.htm;
# ssl_certificate cert/214245831800280.pem;
# ssl_certificate_key cert/214245831800280.key;
# ssl_session_timeout 5m;
# ssl_ciphers ECDHE-RSA-AES128-GCM-SHA256:ECDHE:ECDH:AES:HIGH:!NULL:!aNULL:!MD5:!ADH:!RC4;
# ssl_protocols TLSv1 TLSv1.1 TLSv1.2;
# ssl_prefer_server_ciphers on;
#
# location / {
# root html;
# index index.html index.htm;
# }
# location /teamfortWeChat/ {
# proxy_pass http://teamfortWeChat;
# proxy_redirect off;
# proxy_set_header Host $host;
# proxy_set_header X-Real-IP $remote_addr;
# proxy_set_header X-Forwarded-For $proxy_add_x_forwarded_for;
# proxy_connect_timeout 90;
# proxy_send_timeout 90;
# proxy_read_timeout 90;
# }
#
#}
server { #http配置
listen 80;
server_name 127.0.0.1;
#charset koi8-r;
#access_log /var/log/nginx/log/host.access.log main;
location /spring-boot-admin/ {
if ($remote_addr ~* "116.20.64.169") { #ip不同进入服务不同一般用于灰度发布
proxy_pass http://spring-boot-admin;
}
proxy_pass http://spring-boot-admin-test;
proxy_redirect off;
proxy_set_header Host $host;
proxy_set_header X-Real-IP $remote_addr;
proxy_set_header X-Forwarded-For $proxy_add_x_forwarded_for;
proxy_connect_timeout 90;
proxy_send_timeout 90;
proxy_read_timeout 90;
}
location / {
root html;
index index.html index.htm;
}
#加载其他配置文件
include /etc/nginx/conf.d/server80/*.conf;
#设置例外静态资源,由nginx来处理静态资源#
location ~ \.(html|js|css|png|gif|jpg|jpeg|json|exml|fnt|ttf|TTF|woff|ico)$ {
if ($request_uri ~* /spring-boot-admin/(.*)) { #不需要nginx处理静态资源的项目
proxy_pass http://spring-boot-admin;
}
root /usr/share/nginx/html;
}
location /MP_verify_3YLUBmJdjqIG7yUh.txt { #微信公众号验证文件配置/usr/share/nginx/html
root /usr/share/nginx/html;
}
location /.well-known/pki-validation/fileauth.txt {
root /usr/share/nginx/html;
}
#location / {
# root /usr/share/nginx/html;
# index index.html index.htm;
#}
#error_page 404 /404.html;
# redirect server error pages to the static page /50x.html
#
error_page 500 502 503 504 /50x.html;
location = /50x.html {
root /usr/share/nginx/html;
}
# proxy the PHP scripts to Apache listening on 127.0.0.1:80
#
#location ~ \.php$ {
# proxy_pass http://127.0.0.1;
#}
# pass the PHP scripts to FastCGI server listening on 127.0.0.1:9000
#
#location ~ \.php$ {
# root html;
# fastcgi_pass 127.0.0.1:9000;
# fastcgi_index index.php;
# fastcgi_param SCRIPT_FILENAME /scripts$fastcgi_script_name;
# include fastcgi_params;
#}
# deny access to .htaccess files, if Apache's document root
# concurs with nginx's one
#
#location ~ /\.ht {
# deny all;
#}
}
五. JVM的GC调优
1 | # 启动时加入以下命令用于记录内存溢出时的记录 |
5.1 GC日志
内容详情分析
1
2
3
4
5
6
7
8
9
10
110.756: [Full GC (System) 0.756: [CMS: 0K->1696K(204800K), 0.0347096 secs] 11488K->1696K(252608K), [CMS Perm : 10328K->10320K(131072K)], 0.0347949 secs] [Times: user=0.06 sys=0.00, real=0.05 secs]
1.728: [GC 1.728: [ParNew: 38272K->2323K(47808K), 0.0092276 secs] 39968K->4019K(252608K), 0.0093169 secs] [Times: user=0.01 sys=0.00, real=0.00 secs]
2.642: [GC 2.643: [ParNew: 40595K->3685K(47808K), 0.0075343 secs] 42291K->5381K(252608K), 0.0075972 secs] [Times: user=0.03 sys=0.00, real=0.02 secs]
4.349: [GC 4.349: [ParNew: 41957K->5024K(47808K), 0.0106558 secs] 43653K->6720K(252608K), 0.0107390 secs] [Times: user=0.03 sys=0.00, real=0.02 secs]
5.617: [GC 5.617: [ParNew: 43296K->7006K(47808K), 0.0136826 secs] 44992K->8702K(252608K), 0.0137904 secs] [Times: user=0.03 sys=0.00, real=0.02 secs]
7.429: [GC 7.429: [ParNew: 45278K->6723K(47808K), 0.0251993 secs] 46974K->10551K(252608K), 0.0252421 secs]取倒数第二条记录分析一下各个字段都代表了什么含义
1
5.617(时间戳): [GC(Young GC) 5.617(时间戳): [ParNew(GC的区域): 43296K(垃圾回收前的大小)->7006K(垃圾回收以后的大小)(47808K)(该区域总大小), 0.0136826 secs(回收时间)] 44992K(堆区垃圾被回收前的大小)->8702K(堆区垃圾被回收后的大小)(252608K)(堆区总大小), 0.0137904 secs(回收时间)] [Times: user=0.03(GC用户耗时) sys=0.00(GC系统耗时), real=0.02 secs(GC实际耗时)]
从最后一条GC记录中我们可以看到 Young GC回收了 45278-6723=38555K的内存
Heap区通过这次回收总共减少了 46974-10551=36423K的内存。
38555-36423=2132K说明通过该次Young GC有2132K的内存被移动到了Old Gen
我们来验证一下
在最后一次Young GC的回收以前 Old Gen的大小为8702-7006=1696
回收以后Old Gen的内存使用为10551-6723=3828
Old Gen在该次Young GC以后内存增加了3828-1696=2132K 与预计的相符
内容总结分析
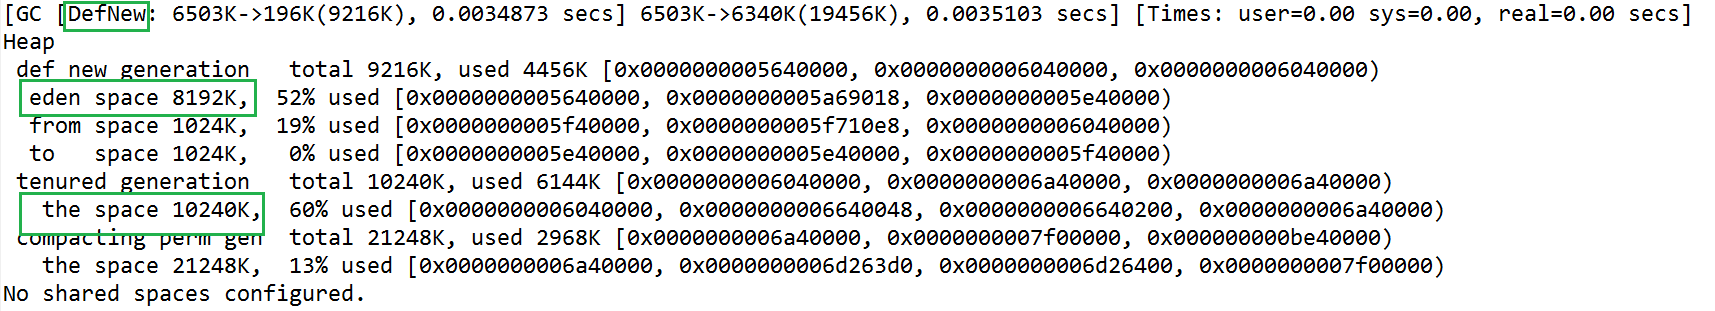
- [GC [DefNew … …]
- GC日志开头的信息通过设置-verbose:gc参数后才能输出。
- “[GC”和”[Full GC”说明这次垃圾收集的停顿类型,如果这次GC发生了Stop-The-World,则为”[Full GC”,否则为”[GC”
- “[DefNew “表示GC发生的区域为Serial收集器的新生代中,DefNew是”Default New Generation”的缩写。Serial收集器的老年代和永久代分别表示为”Tenured”、”Perm”
- ** eden space 8192K, 52% used**
- 新生代的Eden区总共大小为8MB,使用掉的4MB是用来存放allocation4对象
- tenured generation total 10240K, used 6144K
- 老年代大小为10MB,使用掉的6MB是用来存放allocation1、allocation2和allocation3这3个对象
6 工具
在线GC日志分析
JVM在线调优
visualGC 日志工具
7 JVM知识的优秀文章
【JVM调优总结-有着详细的jvm知识介绍】: https://www.jianshu.com/p/51d82de75d3d